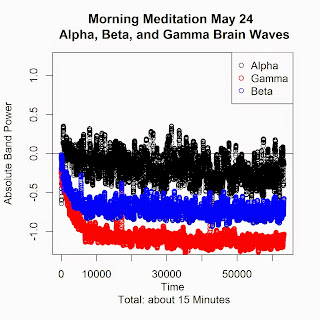
I've included in this post four figures that show brain waves from a 15 minute morning meditation. Actually, these figures show brain waves from the second meditation of the morning. The first meditation was full of distraction and an active mind still disturbed from sleep. I unfortunately don't know too much about how to interpret the brain wave activity shown in the figures. The gamma wave activity goes to about zero, beta drops, alpha drops slightly, while theta and delta drop considerably. I note two spikes in the gamma and delta waves, though I don't know what aspect of the meditation they represent. As always, I use the Muse to record the brain waves, and the Muse Monitor app to export the raw data.


No comments:
Post a Comment